Systems Thinking Through Service Blueprinting
Taming Global Complexity: Creating a Scalable Service Blueprint
How I designed and built a custom service blueprint tool to solve an insurmountable data challenge and drive a global product strategy at Computershare.
Company
Computershare
Timeframe
2 months
Team Structure
Service Designer (myself)

The Challenge: Finding Unity in Global Complexity
Computershare, a company that provides corporate trust, stock transfer, and employee share plan services, aimed to develop a single, global tool to manage Annual General Meetings (AGMs), which are crucial yearly events for companies and their shareholders.
The problem
AGM processes varied immensely across key countries, each involving over 100 distinct steps. Standard blueprinting tools were too static to handle this volume of data, creating a massive roadblock for our product strategy.

Vast Differences Between Countries
Processes, tools, voting methods, and stakeholders differed significantly across the US, UK, Canada, Germany, and Australia.

Overwhelming Amounts of Data to Wrangle
With over a hundred steps per country, manually documenting and comparing thousands of data points was inefficient and prone to error.

The Need for Scalable Solution
I needed a scalable, dynamic solution to capture, compare, and visualize these complex journeys to find common ground for a new product.
How might we capture and make sense of thousands of data points from disparate global processes to inform a cohesive product strategy?
I was tasked with understanding and mapping the highly complex AGM processes across multiple countries to identify commonalities for a new, unified global product.
The Approach:
A Two-Phase Journey
When faced with the limitations of existing tools, I leveraged my background in service design and process automation to create a novel solution.
I would innovate to build the tool myself.
The Process

Designing a Custom Blueprinting Tool
I designed and built a custom, scalable service blueprint application in Excel, featuring separate tabs for standardized data entry and automated, real-time visualization.
1

Engaging & Training Stakeholders
I met with AGM leads from seven countries, training them on the tool. This not only streamlined data collection but also empowered them to compare their own processes with others.
2

Managing Competing Priorities with Innovation
When the CIO requested additional dashboard functionality, I used my tool's design to solve the new demand. By delegating data entry to the now-trained country leads, I freed up my own capacity to build the high-priority features for the CIO without derailing the original project.
3
Under the hood of a Custom Tool for Unprecedented Complexity
Standard blueprinting tools like Miro were incapable of handling this project's scale. The need to track over a hundred constantly changing steps across multiple countries demanded a dynamic, robust, and flexible solution that could manage thousands of data points and provide real-time visualizations.
A Data Entry Tab
A structured table where I, or the country leads themselves, could easily input each process step with details like actors, systems, channels, and pain points. This allowed for asynchronous and standardized data collection.
An Automated Visualization Tab
Using advanced formulas and macros, this tab would automatically transform the raw data into a clean, easy-to-read service blueprint, updating in real-time as changes were made.
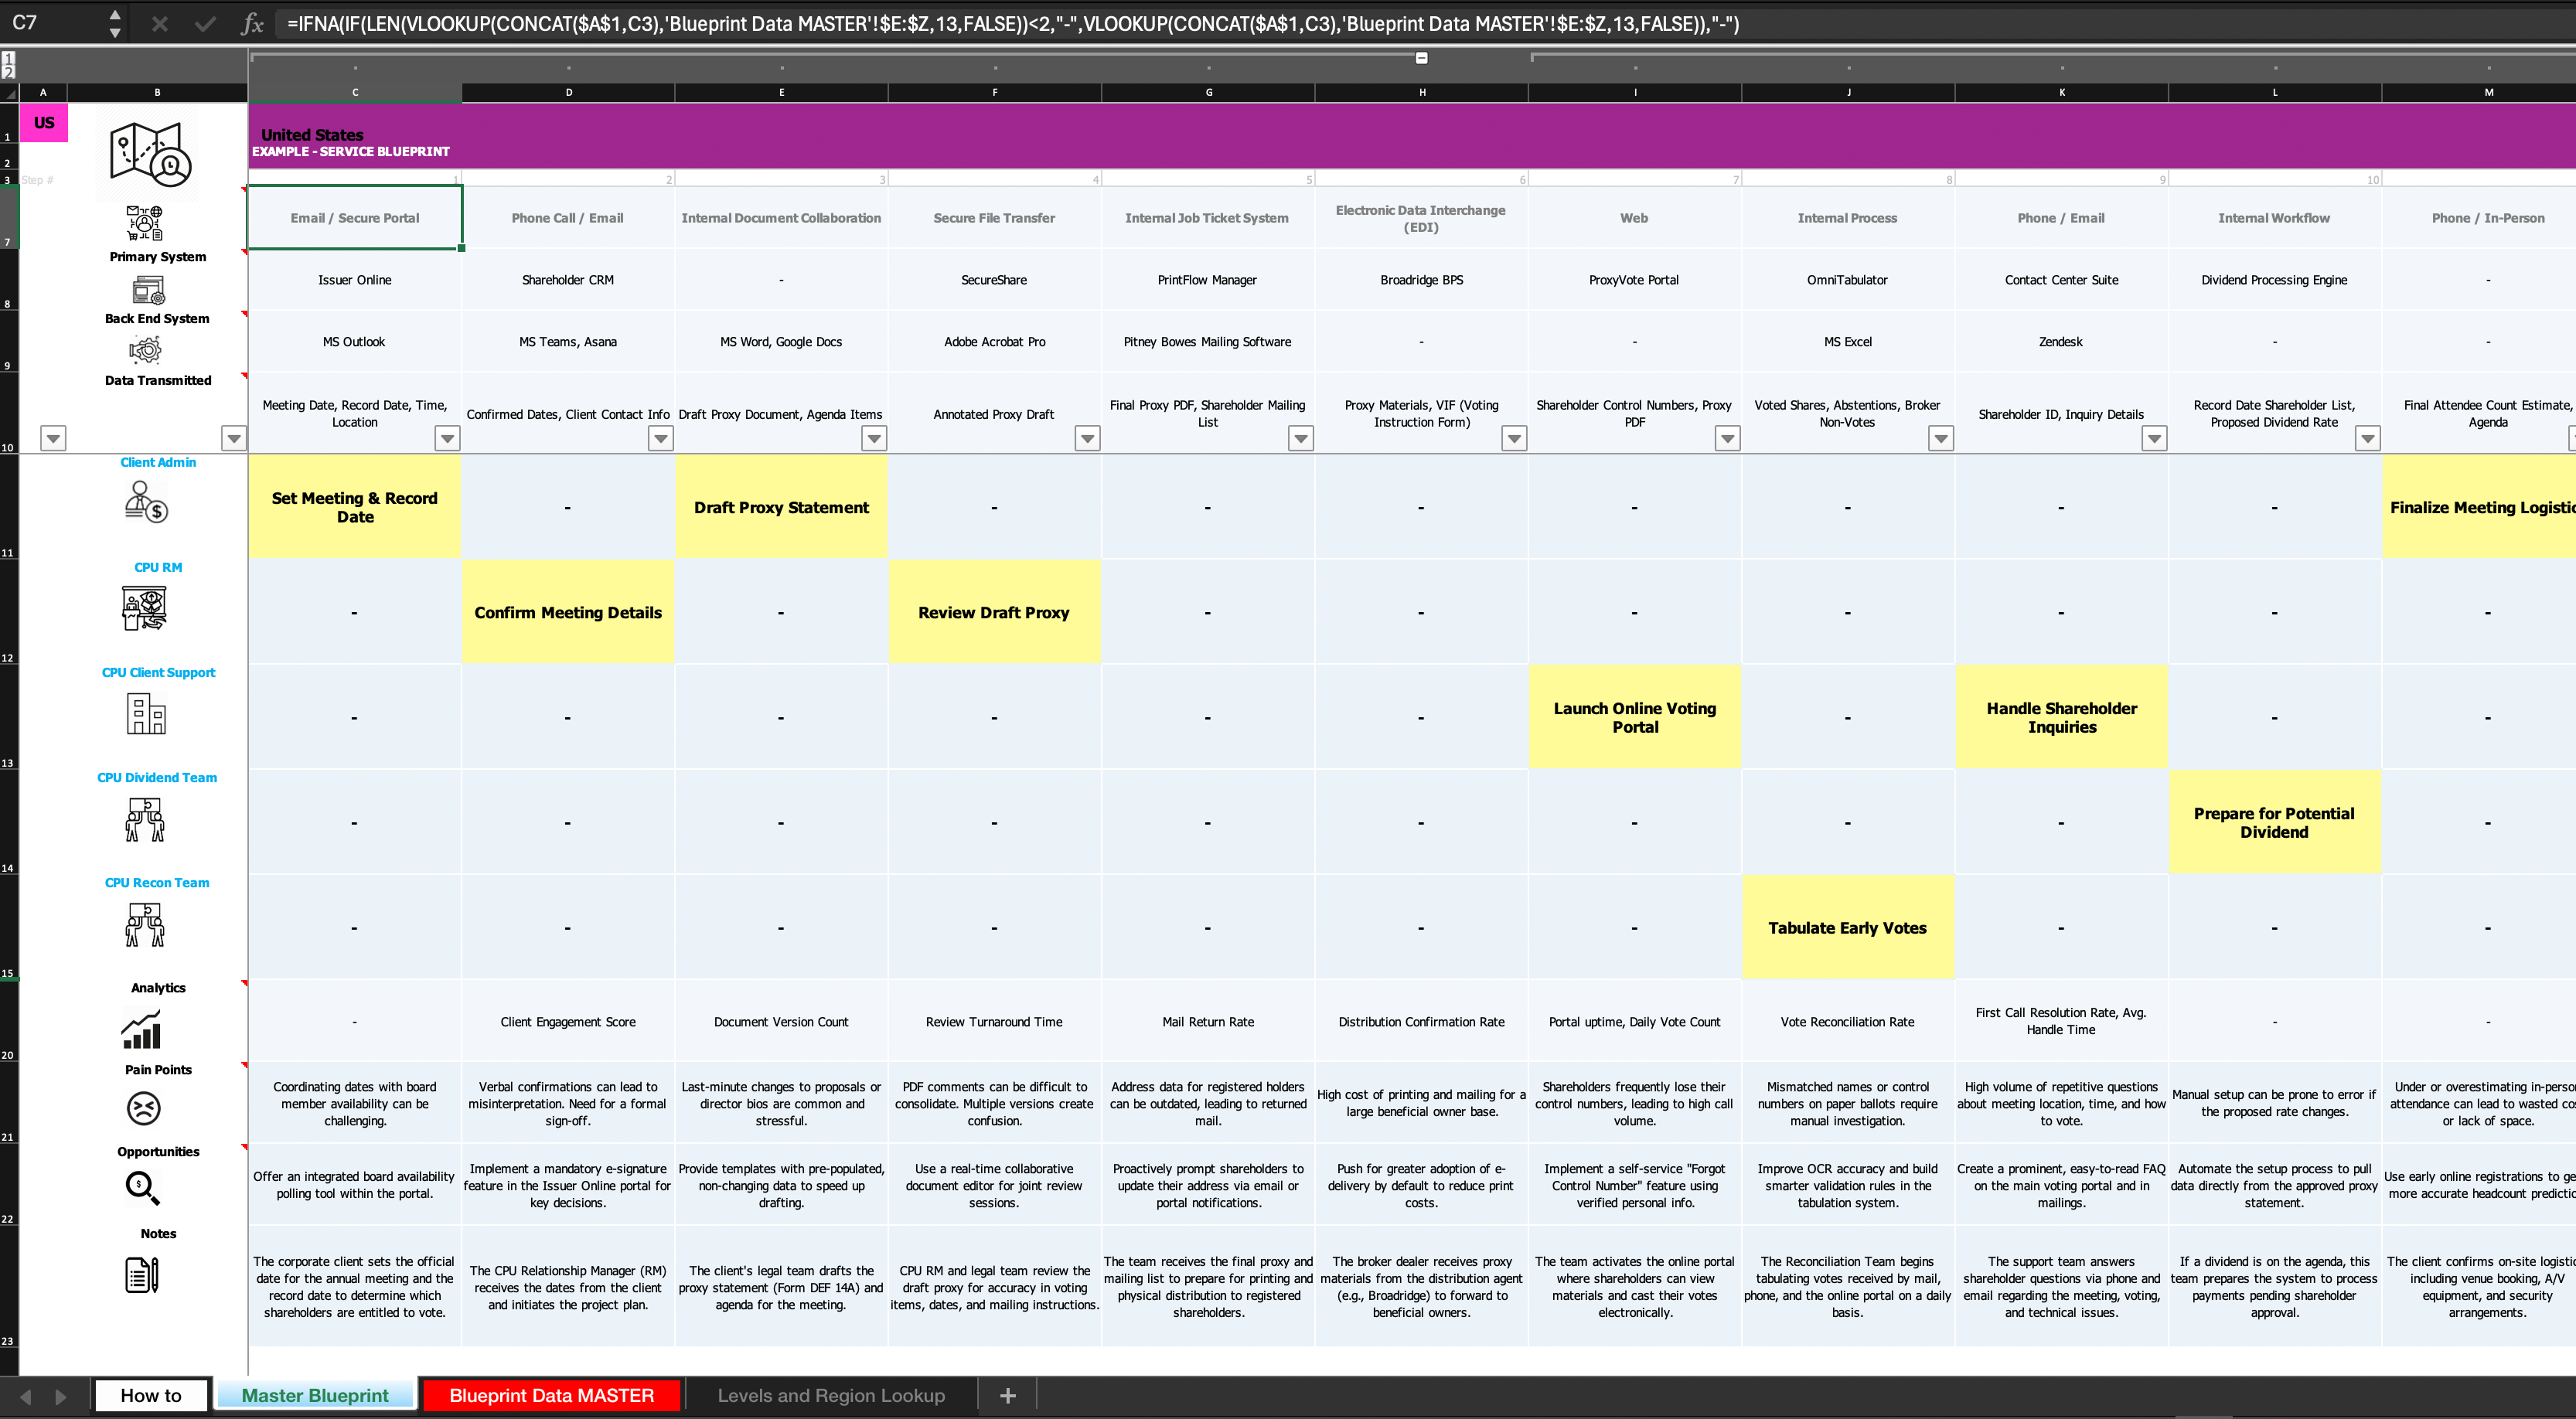
The data in the Automated Visualization Tab is populated from the Data Entry tab in real-time.
The Solution: A Dynamic, Data-Driven Blueprint
My custom tool provided a dynamic and scalable way to manage and visualize incredibly complex service journeys where standard methods had failed.

Data-Driven Visualization
Automatically generated clear service blueprints from raw data inputs.

Real-Time Updates
Blueprints updated instantly as data was added or changed, ensuring accuracy.

Powerful Comparison
Allowed teams to easily filter, sort, and compare processes across countries to find patterns.

Collaborative & Asynchronous
Empowered country leads to contribute data directly on their own time.
Outcomes & Impact: Driving Strategy and Visibility
The innovative approach and custom tool delivered significant value, influencing both product strategy and executive decision-making.
Unified Product Strategy
The insights were instrumental in designing the new "Investor Vote" tool, ensuring it met the needs of five countries at launch.
Executive Insight
Provided the CIO a powerful dashboard to visualize global processes, earning the project high-level visibility.
Drastic Efficiency Gains
Streamlined an insurmountable data task, saving weeks of manual work.
A Reusable Asset
The tool became a recognized, reusable template for mapping other complex service journeys in the company.
Reflections & Professional Growth
This project was a profound learning experience that honed my skills as a senior UXR and strategic consultant.
Innovation Solves
Competing Priorities
This project taught me that the best way to manage competing demands is often through process innovation. Building a tool to automate and delegate my original task was key to taking on new, high-priority work from the CIO.
Leverage Your Unique Skillset
My background in both UX and process automation was the key to success. I learned the importance of looking beyond traditional UXR methods to find creative solutions to complex problems.
Empowerment Through
Delegation
Training country leads and giving them ownership over their data entry not only saved time but also dramatically increased their engagement and investment in the project's success.
Visibility Creates Opportunity
A novel solution that clearly provides value will naturally attract executive attention. Being prepared to explain and adapt your solution for a leadership audience is a critical skill for driving impact.


Systems Thinking Through Service Blueprinting
Taming Global Complexity: Creating a Scalable Service Blueprint
How I designed and built a custom service blueprint tool to solve an insurmountable data challenge and drive a global product strategy at Computershare.
Company
Computershare
Timeframe
2 months
Team Structure
Service Designer (myself)
The Challenge: Finding Unity in Global Complexity
Computershare, a company that provides corporate trust, stock transfer, and employee share plan services, aimed to develop a single, global tool to manage Annual General Meetings (AGMs), which are crucial yearly events for companies and their shareholders.
The problem
AGM processes varied immensely across key countries, each involving over 100 distinct steps. Standard blueprinting tools were too static to handle this volume of data, creating a massive roadblock for our product strategy.
Vast Differences Between Countries
Processes, tools, voting methods, and stakeholders differed significantly across the US, UK, Canada, Germany, and Australia.
Overwhelming Amounts of Data to Wrangle
With over a hundred steps per country, manually documenting and comparing thousands of data points was inefficient and prone to error.
The Need for Scalable Solution
I needed a scalable, dynamic solution to capture, compare, and visualize these complex journeys to find common ground for a new product.
How might we capture and make sense of thousands of data points from disparate global processes to inform a cohesive product strategy?
I was tasked with understanding and mapping the highly complex AGM processes across multiple countries to identify commonalities for a new, unified global product.
My Approach: Innovating When Standard Tools Fail
When faced with the limitations of existing tools, I leveraged my background in service design and process automation to create a novel solution.
I would innovate to build the tool myself.
The Process
Designing a Custom Blueprinting Tool
I designed and built a custom, scalable service blueprint application in Excel, featuring separate tabs for standardized data entry and automated, real-time visualization.
1
Engaging & Training Stakeholders
I met with AGM leads from seven countries, training them on the tool. This not only streamlined data collection but also empowered them to compare their own processes with others.
2
Managing Competing Priorities with Innovation
When the CIO requested additional dashboard functionality, I used my tool's design to solve the new demand. By delegating data entry to the now-trained country leads, I freed up my own capacity to build the high-priority features for the CIO without derailing the original project.
3
Under the hood of a Custom Tool for Unprecedented Complexity
Standard blueprinting tools like Miro were incapable of handling this project's scale. The need to track over a hundred constantly changing steps across multiple countries demanded a dynamic, robust, and flexible solution that could manage thousands of data points and provide real-time visualizations.
A Data Entry Tab
A structured table where I, or the country leads themselves, could easily input each process step with details like actors, systems, channels, and pain points. This allowed for asynchronous and standardized data collection.
An Automated Visualization Tab
Using advanced formulas and macros, this tab would automatically transform the raw data into a clean, easy-to-read service blueprint, updating in real-time as changes were made.
The data in the Automated Visualization Tab is populated from the Data Entry tab in real-time.
The Solution: A Dynamic, Data-Driven Blueprint
My custom tool provided a dynamic and scalable way to manage and visualize incredibly complex service journeys where standard methods had failed.
Data-Driven Visualization
Automatically generated clear service blueprints from raw data inputs.
Real-Time Updates
Blueprints updated instantly as data was added or changed, ensuring accuracy.
Powerful Comparison
Allowed teams to easily filter, sort, and compare processes across countries to find patterns.
Collaborative & Asynchronous
Empowered country leads to contribute data directly on their own time.
Outcomes & Impact: Driving Strategy and Visibility
The innovative approach and custom tool delivered significant value, influencing both product strategy and executive decision-making.
Unified Product Strategy
The insights were instrumental in designing the new "Investor Vote" tool, ensuring it met the needs of five countries at launch.
Executive Insight
Provided the CIO a powerful dashboard to visualize global processes, earning the project high-level visibility.
Drastic Efficiency Gains
Streamlined an insurmountable data task, saving weeks of manual work.
A Reusable Asset
The tool became a recognized, reusable template for mapping other complex service journeys in the company.
Reflections & Professional Growth
This project was a profound learning experience that honed my skills as a senior UXR and strategic consultant.
Innovation Solves Competing Priorities
This project taught me that the best way to manage competing demands is often through process innovation. Building a tool to automate and delegate my original task was key to taking on new, high-priority work from the CIO.
Leverage Your Unique Skillset
My background in both UX and process automation was the key to success. I learned the importance of looking beyond traditional UXR methods to find creative solutions to complex problems.
Empowerment Through Delegation
Training country leads and giving them ownership over their data entry not only saved time but also dramatically increased their engagement and investment in the project's success.
Visibility Creates Opportunity
A novel solution that clearly provides value will naturally attract executive attention. Being prepared to explain and adapt your solution for a leadership audience is a critical skill for driving impact.
